Tuesday, May 19, 2009
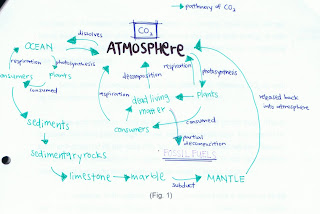
Well, Pei Xin asked this question in class one day: Have we ever thought about why physical geography is put under Integrated Sciences? I thought it would be interesting to summarise this blog with this question as well as some other facts and notes about what we have learnt. Of course, the stuff I put up here are just really brief summaries of what we learnt, so everyone better go and mug still!I remember Mr Heah once said, physical geography is a science on itself. Earth science. Maybe that’s why it is put under IS? Physical geography studies more of the features on Earth. For example: volcanoes, atmosphere, hydrosphere, rivers etc. If you all paid close attention, actually within all these features/topics, science is very important. It’s all about how everything works in a system. Once you understand one part, and link it up with other parts, there you have it! Everything linked up together which makes perfect sense. I feel that science is more on how things work as well as why things work. How they happen, and why they happen. That’s mainly the reason why I think physical geography’s under IS.
Okay, now for the summaries.
 So here's basically like the rough idea that we need to study according to Pei Xin.
HYDROSPHERE:
ALL THE BEST PEOPLE FOR GEOGRAPHY!!
- joanne
Tuesday, May 5, 2009
The geo test will be on week 10The following topics will be tested:
Atmosphere:
Climographs
Seasons
Climates
Rain/clouds formation
Hydrosphere
Water cycle
Water balance
Hydrographs
Features-formation
do revise all these and jiayou for your test :)
xingru
River features: Waterfalls, meanders and braidings
This post is about the content of two lessons which are on 28th of April and 29th of April.Definition: A waterfall is a sudden step in a river's long profile.
Reasons for its formation: The main reason for the formation of a water fall are different bands (layer) of rocks through the bed of a river. When a river is flowing on the ground, it will erode the rock band on its bed. If this erosion happens on the cross section of different layers of rocks, a difference in erosion will occur because of the different hardness of different kind of rock. Therefore, when the river flow through from a harder rock band to a softer rock band, a steep step will be formed because of the difference in erosion. This is how waterfalls are formed.
Meader
Definition: Meaders are the wind and curve features through river's' course. Meaders are brobably the most common river feature.
 Reasons for its formation: Meanders are formed mainly because of the riffles and pools in rivers. Riffles and pools are the shallower and deeper part of a river's bed. Water will never flow straight so that rivers will be twisted even if they are straight originally. When water flow through riffles and pools, a Helicoidal flow will occur because of the differences in velocity of river flow.
 (From: https://blogger.googleusercontent.com/img/b/R29vZ2xl/AVvXsEiqYbUWm3cgEjyX-XsV7Hz7sL7GA1KLcTGfhHdLy_KOvivAIUz1jSwutXc6fUmahBquwYrDLNMRgQICQ06D8uRnvb7XbGW7MN5BN-l7b54R4GXAFQ71BsctvoA2HQFhX-IifpBFnId-aoU/s320/helicoidal+flow+3.jpg)
Helicoidal flow is a cockscrew movement of water responsible for moving eroded river load from the outer bank and then depositing much of it on the next inner bank of a river. When helicoidal flow happens, river will start to shift outwards. This will make the river even more winded. Meanders will finally be formed by the during the process of helicoidal flow.
 (From: https://blogger.googleusercontent.com/img/b/R29vZ2xl/AVvXsEiBKnzSXd_ch0M7CSTUY2jjh1ztAhBDhcwkI52CTN7edcatcsjB12q008tDZM1lYCaQ0gP7_p-auOsGieVx_sGc0zUmWiOjmsfMVFPv-if-44cfAFMGQ50CFb5JeHV-nNHTqJmUBX7y2VU/s1600/helicoidal+flow+2.bmp)
 (From: http://www.ucpress.edu/books/pages/6664/moj01a.jpeg)
Braiding
Definition: Braidings are formed when a river subdivides into many smaller streams within its channel.
 (From:http://www.braidedriver.net/braided_river_blue.jpg)
Reasons for its formation: There are two resons for the formation of braidings. One is the easily erodable channel sides and the other is the highly irregular discharges. Easily erodable channel sides make it easier for water to erode out different routes or gaps. And irregular discharges make it possible for water to have different velocity and baseflow. A different route of water flow may be formed when there is a change in velocity and base flow. This will make up some small island in the river. And this is how braidings are formed.
 (From: http://www.gly.uga.edu/railsback/1121RiverOxBow.jpeg)
The picture above is the formation of a Ox-Bow Lake. It also reflected the effect of different discharge. In the third picture, a braiding is formed because of the larger discharge in that period.
Poster: JAY ZHAN WEI HENG
Thursday, April 23, 2009
I will be doing the blog posts on two lessons, last week’s (14th April) and today (22nd April).Last week’s lesson was a rather short lesson. Basically, we learnt about a river, that a river has energy, and that various energies affect how a river behaves or looks like. Also, we discussed about the different factors that affects a river’s energy.
A river’s energy is mainly contributed by:
1. Volume
2. Velocity
The higher the volume and velocity of a river, the more energy a river has.
So what affects the velocity of a river? Basically, there are mainly two factors involved, namely Gravity and Friction, in other words, Channel Shape.
Moving on to today's lesson, we learnt about the different features and formations of rivers , about the Hjulstorm curve works and how velocity is a vital component in determining how a river behaves.
Firstly,
What are the different sections of a river?
 What is Erosion?
Erosion is defined as the picking up and removal of material.
There are mainly five processes affecting erosion:
1. Corrosion
2. Abrasion
3. Hydraulic action
4. Solution
5. Attrition

Hjulstrom Curve

Area between erosion and deposition velocity: transportation of load occurs
Area above erosion velocity: erosion of load will occur
Area below deposition (fall) velocity: deposition of load occurs
Note: erosion and deposition velocity values vary with load!
Ok then, i’m done
Darryl
P.S. I apologize for the low quality pictures
Thursday, April 9, 2009
8th April 2009
Today we revisited the factors which affected the hydrographs as well as went through the answers for the exercise given to us(pg 231 of text). We also learnt more about various factors such as shape of basin and how it affected the hydrographs and more about drainage density.This is mainly what we went through for the answers in the activity:
1. Lag time
2. Shapes of basin affecting shape of hydrograph
3. Drainage density and how it affects hydrographs
4. Effects of vegetation and urbanization on hydrographs
So what is a drainage basin? For those who did not know yet, it’s actually like the idea of funnels, the imaginary area where rainwater collects or drains into.
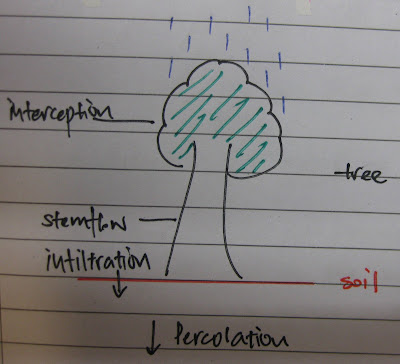
“Lag time” is defined as the time between peak rainfall and peak discharge. Another explanation could be the time taken for the river to react to rainfall.Lag time happens because of processes like interception, stem flow, infiltration as well as percolation which affect the movement of water (see picture below).Therefore, the water will take time to flow and reach the mouth of the drainage basin, going through other processes such as base flow to reach the drainage basin.
(Baseflow – defined as the basic amount of water flowing through the river when there is no rainfall.)
Link between lag time and likelihood of flooding:
With a shorter lag time, the more the runoff, if the water level is higher than bankful discharge, it would mean that flooding will occur.
For example, look at these 2 rivers. Note that the amount of rainfall is the same.
River A (Shorter lag time)
There is a lot of runoff(overland flow) in river A, thus causing the water level to raise above bankful discharge.
River B (Longer lag time)

In river B, factors such as bigger surface area, increase in interception, infiltration and percolation, thus the water will take a longer time to flow. With a longer time to flow, there is lesser runoff, thus the amount of water does not exceed it’s bankful discharge.
(Bankful discharge: Maximum amount of water that can flow in a river without over flowing it’s banks)
Secondly, we discussed about the shape of the basins and how the shape affected the shape of the hydrograph (pg 230)
Drainage basin C Vs Drainage basin D ( long vs round drainage basin)
Drainage basin C

Drainage basin D

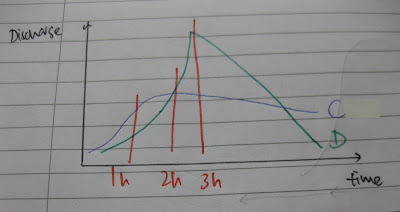
Graph Between drainage basin C and D

We also discussed how different shapes affected the graphs, how much water and how long the water will take to reach the mouth of the basin.
a)
b)
[The numbers represent the water flow, and 1 comes first as it is nearer to the mouth of the drainage basin. The arrows show the different distances the water has to flow before reaching the mouth of the basin and how much water there is, thus affecting the shape of the graphs.]
Thirdly, drainage density.
The higher the drainage density, the more rivers, which would mean more surface runoff (When water falls as rain, it directly falls into the rivers, going straight to the mouth of the drainage basin.)
Drainage Basin A (Lower drainage density)
- Graph tends to be gentler
Drainage Basin B (Higher drainage density)

- Graph tends to be steeper
Lastly, moving on to the effects of vegetation and urbanization.
- Vegetation -> increase in interception -> increase of infiltration -> increase of ground water. Therefore longer lag time, less steep rising and falling limb of hydrograph.
- Urbanisation -> decrease of infiltration -> increase of runoff -> decrease of ground water. Therefore shorter lag time, steeper rising and falling limb of hydrograph.
Yup, That’s all folks!
Darren.
April 7th entry
Today Mr Faizhal went to our class and told everyone to read the textbook page 240, which is about the River channel processes. Here is a summary of these 2 pages:
Water energy depends on: the amount of water
the steepness of the slope.
Competence: ability of river to transport sediment.
Load: material carried by the river.
Sediment movement depends on:
1) Nature of the bed and banks
2) The flow of the river
3) Human intervention.
Erosion: the picking up and removal of material. Three processes of erosion:
1) Corrasion (most significant type): particles of rock carried by the river grind away at the bank and bed.
2) Hydraulic action: water crashes on onto the bed or against the banks.
3) Solution: Carbon dioxide in water may react with limestone and chalk.
Deposition occurs where particles can not be carried any more due to the small flow speed. Some places where it can occur: inside bend of meander, bed of river, close to river’s bank, where river enters the sea, etc.
Velocity is the main factor controlling transportation, erosion and deposition.
The Hjulstrom curve has a critical erosion velocity line and a critical deposition line. Basically, it is like this:
- The larger the particle the greater the velocity required to pick it up. (It makes sense right)
- However the small particles tend to stick together, so higher velocity required to pick them up. (It also make sense right?)
- Velocity falls, successively smaller particles drops.
There is an increase in velocity with distance downstream, due to:
- Greater volume of water, because water from many sources join the main flow.
- Roughness of channels is reduced because silt replaces pebbles and boulders è less turbulence.
- Channel tends to adopt more efficient profile.
It was raining romantically today, that’s why Mr. Faizhal asked the whole class to go out and look at the rain. We observe the overland flow, the process of interception and the maximum infiltration capacity of the land. We observe the flow of water outside 01 classroom. We discussed the hydrograph of a random point along the flow. The hydrograph should be very steep with a short lag time.
That’s all we have for today lesson. It was quite interesting as the whole back row people were laughing all the times, and no one slept in class.
-Lam-
Monday, April 6, 2009
1st April 2009
Hi all! Happy April Fool's Day! Sorry for the belated post for the 1st of April Geography Lesson with Mr. Faizal. Anyway, here it is:We started of on the revision of water balance, where Input = Output. Input consists of the precipitation and the Output consists of total streamflow (Q), evapotranspiration (E) and storage (S).
We then moved on to the section on Hydrographs. Basically, a hydrograph shows how a river reacts to rainfall. So there are 5 main sectors of the Hydrograph.
1) Antecedent flow rate
- This is the point before the rainfall effect starts and is at the start of the hydrograph
2) Rising Limb
3) Peak of the graph
- This part of the graph is known as the peak flow rate, where peak discharge is observed
4) Falling Limb
5) Groundwater recession
- After the rainfall, when the river's discharge is close to zero.
And there are other important details to remember in a hydrograph.
Firstly, the baseflow and stormflow. The storm flow is the sector of the graph between the rising limb and the falling limb and the baseflow is the sector of the graph between the Antecedent flow rate and Groundwater Recession.
Secondly, the bankfull discharge. The point of bankfull discharge is determined by calculations. If the graph goes above the bankfull discharge level, it means that the river experiences a flood.
And thirdly, the lag time. Basically, the lag time is the time between peak rainfall (Antecedent flow rate area) and peak discharge (Peak flow rate of graph)
We then evaluated how and why storm hydrographs differ. This is dependant on many factors, such as the rate of rainfall, amount of rainfall, and basins with impermeable bedrock.
The rate of rainfall determines the overland flow. If there is high rate of rainfall, there is high overland flow, resulting in dramatic hydrographs, with steep limbs and high peaks.
Less dramatic hydrographs occur when there is light, summer rain when evaporation rates are high and when discharge is easily absorbed.
Ok, so that's about it! I hope I didn't miss out much. Please add in comments too. See Ya!
Akshay


